Widgets
Learn more about Sentry's Insights widgets such as Most Slow Frames, Most Time-Consuming Queries, and Slow HTTP Ops, and how they can be used to surface performance insights in your applications.
Insights widgets offer visualizations that you can change to best match your workflow. They provide performance-specific views that allow you to see and act on transaction data across your organization. Depending on which Insight Domain you've selected, different curated performance widgets will be available.
The value displayed in the top right of some widgets is the overall value for the selected time period, not the average of the data displayed in the chart. For datasets with low event volume, the overall value may be higher or lower than expected because metrics like Apdex and User Misery are non-linear.
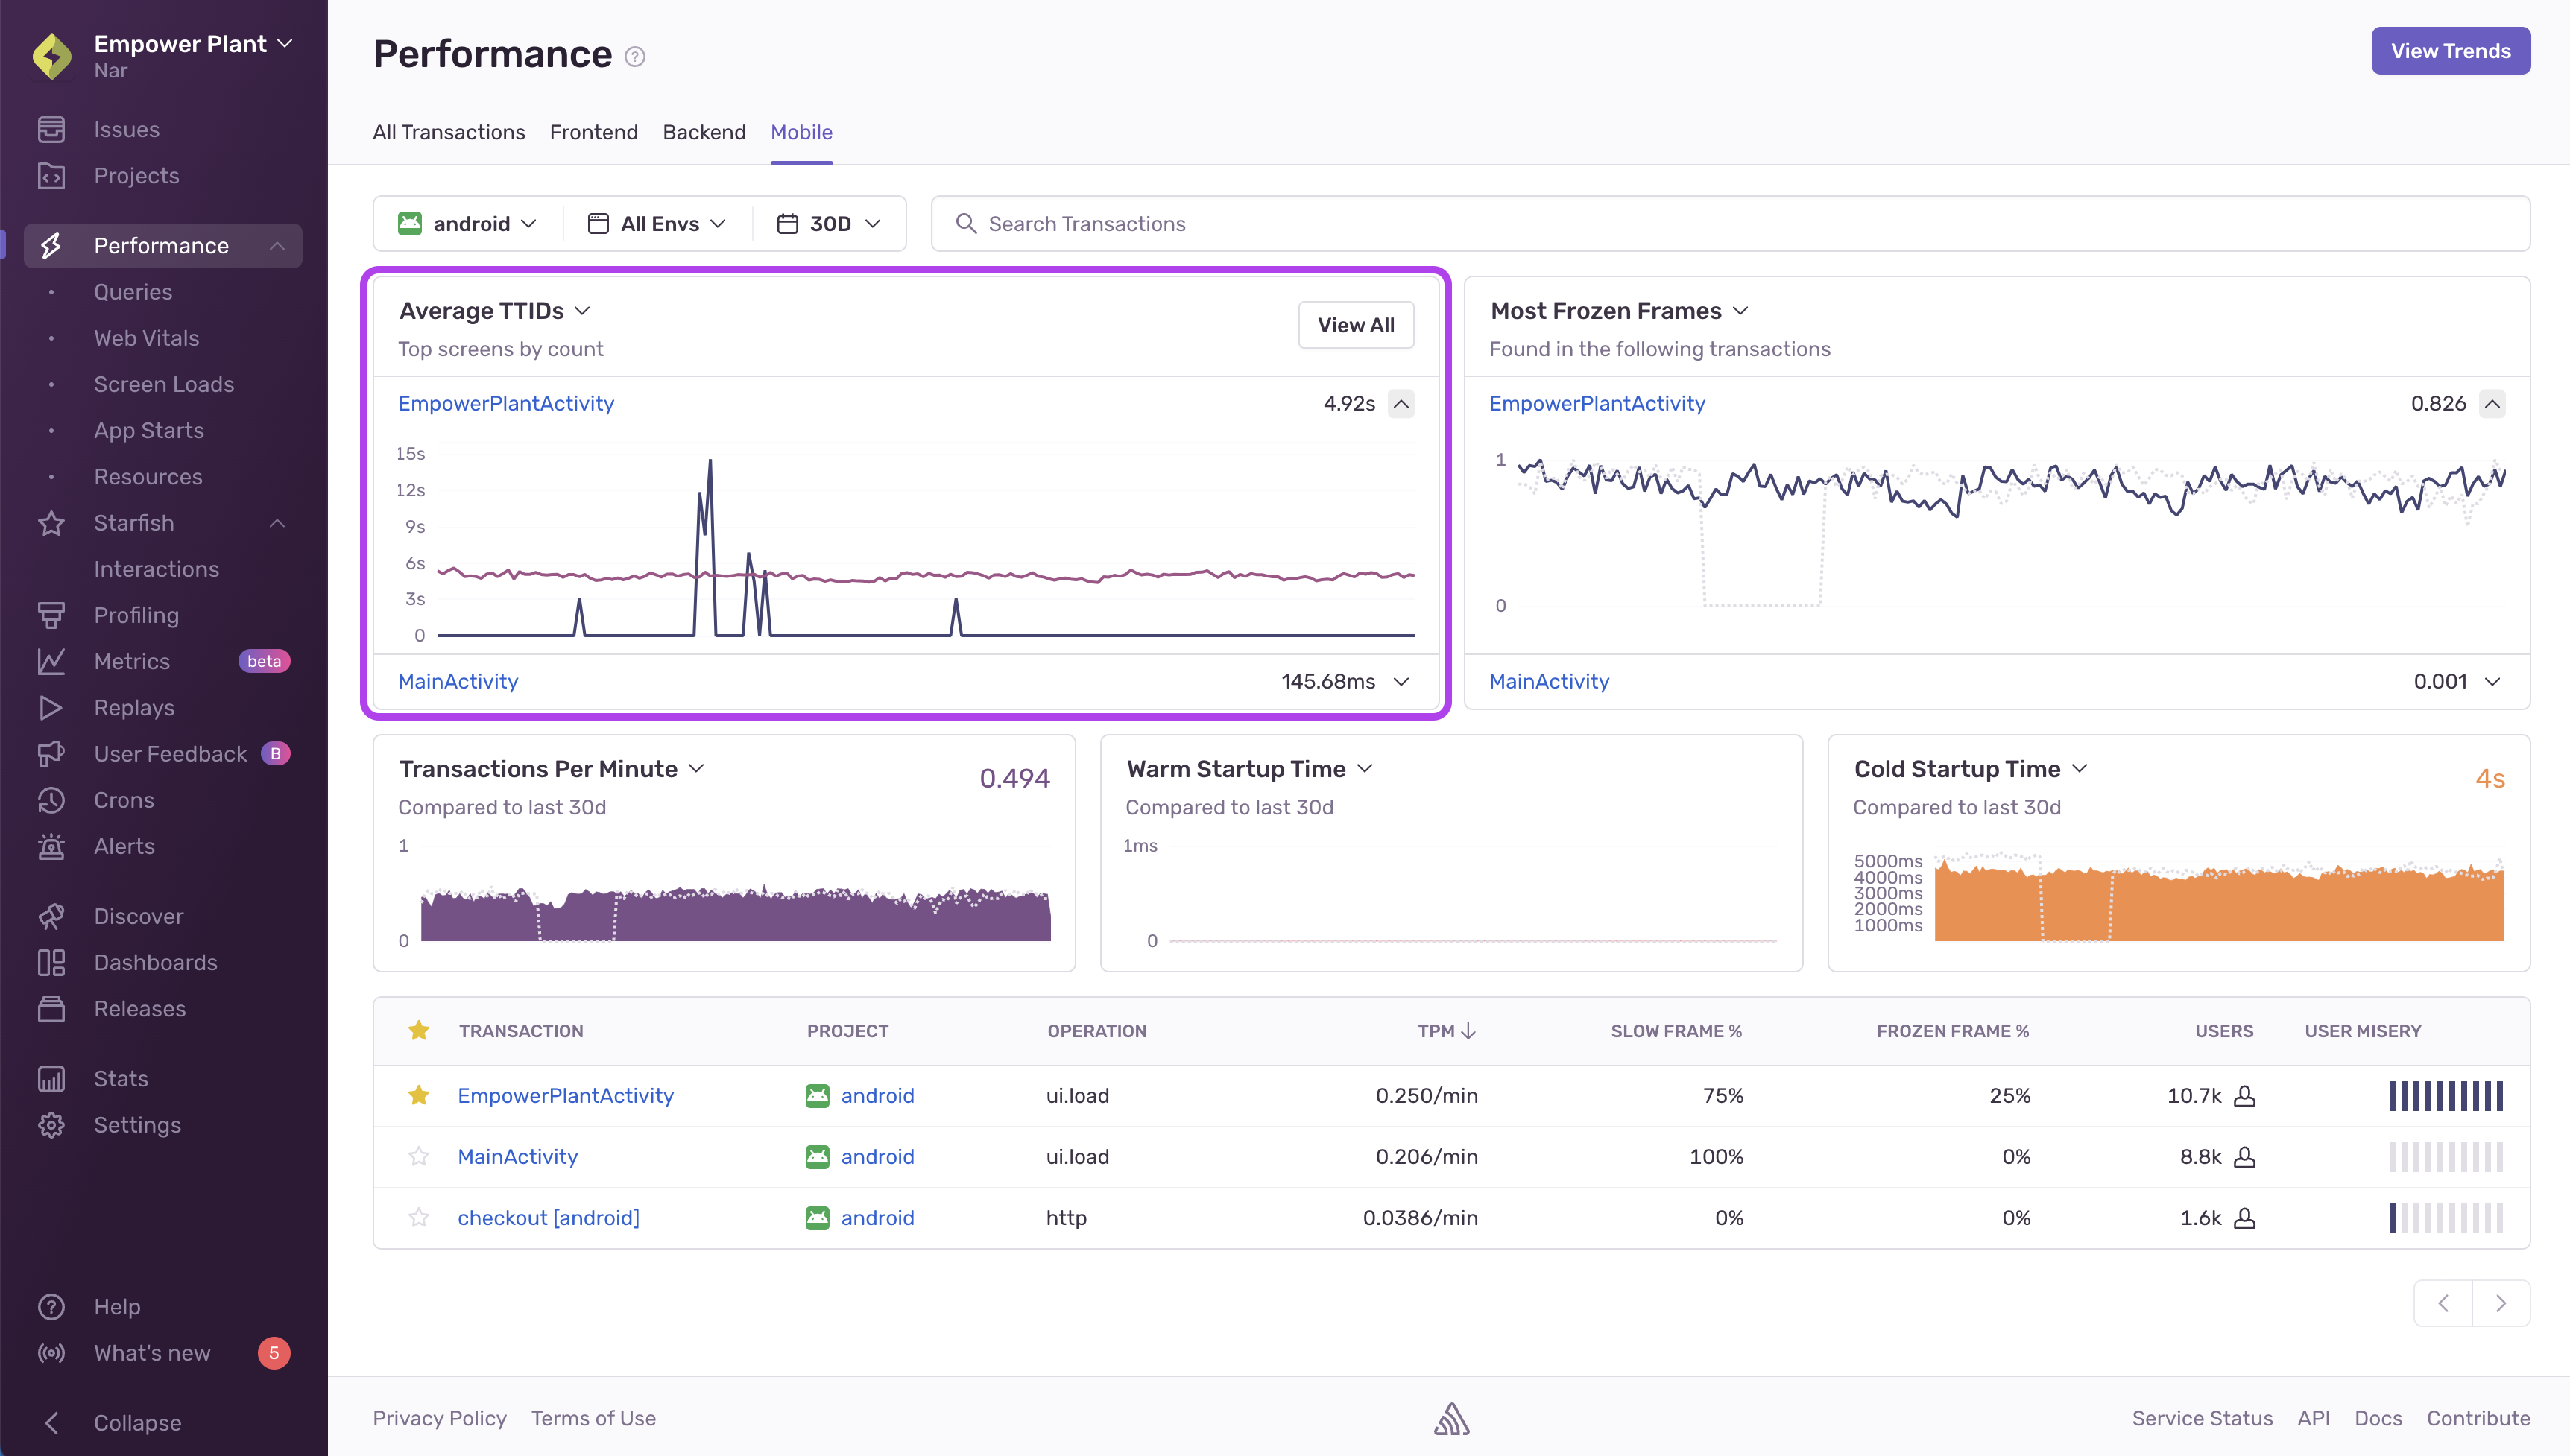
Shows the average TTID duration for top screens for mobile projects. Click the screen name to view more information about the screen in the Screen Loads page.
This widget is available in the Mobile Overview.
Shows transactions with the most slow frames for mobile projects. Learn more in Mobile Vitals.
This widget is available in the Mobile Overview.
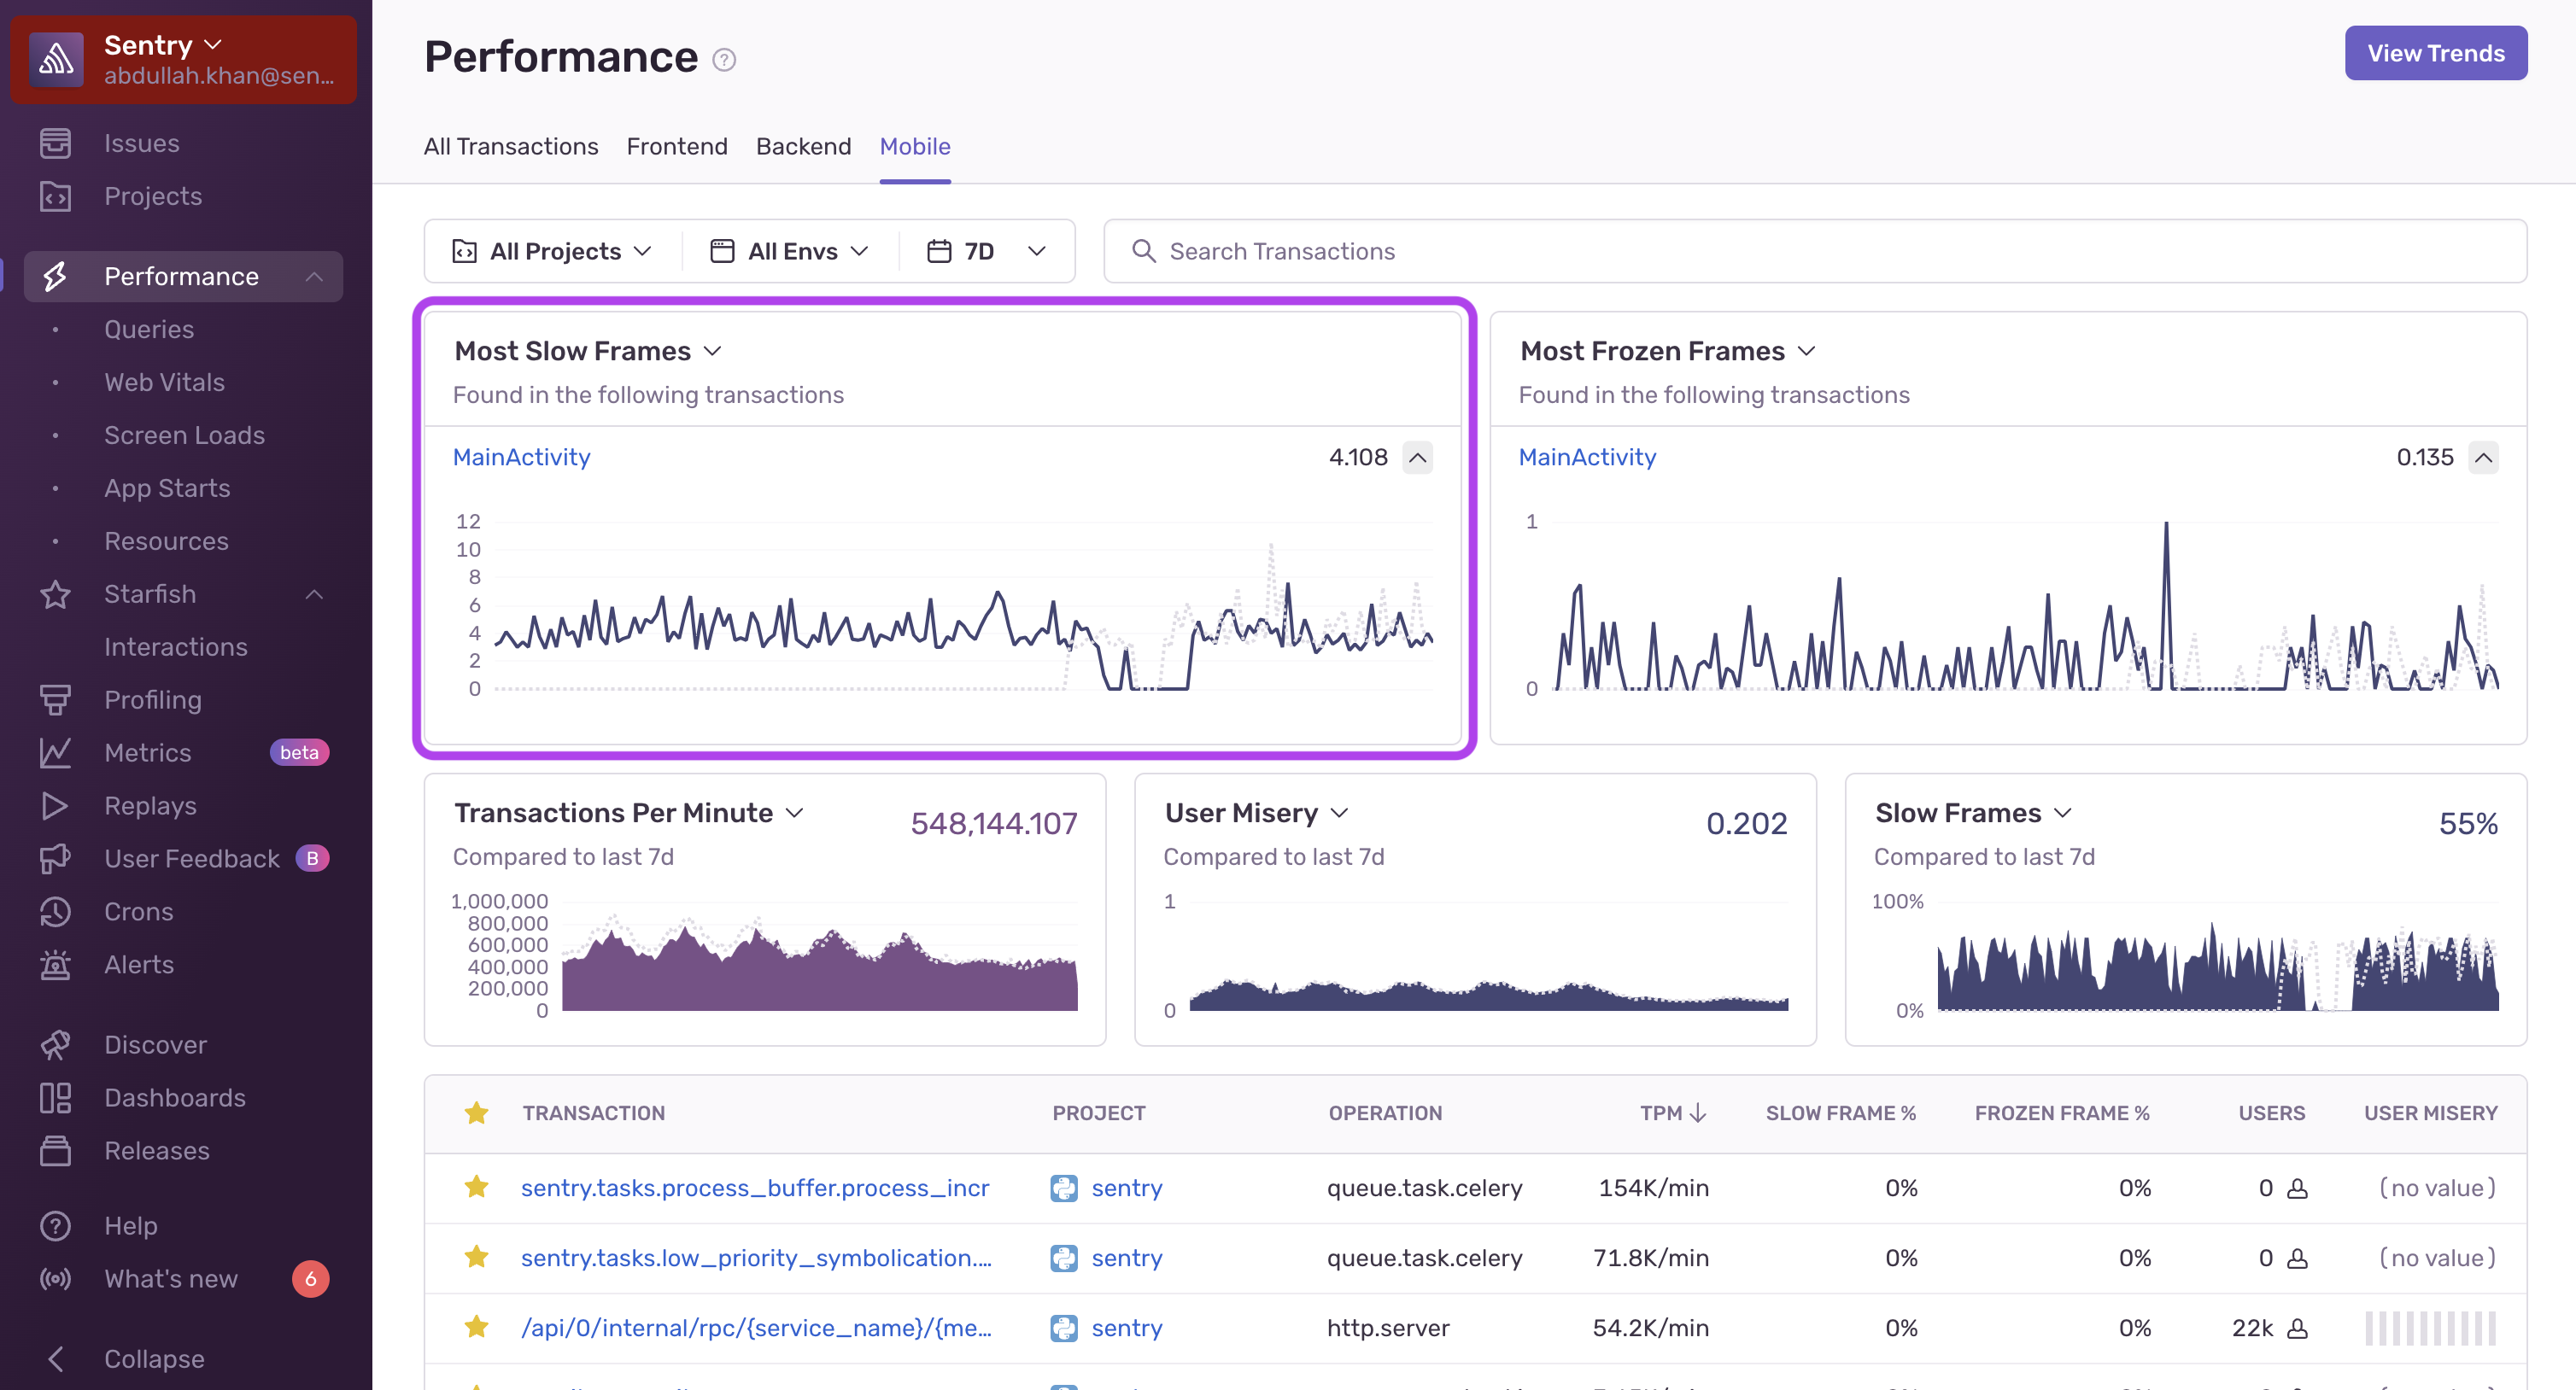
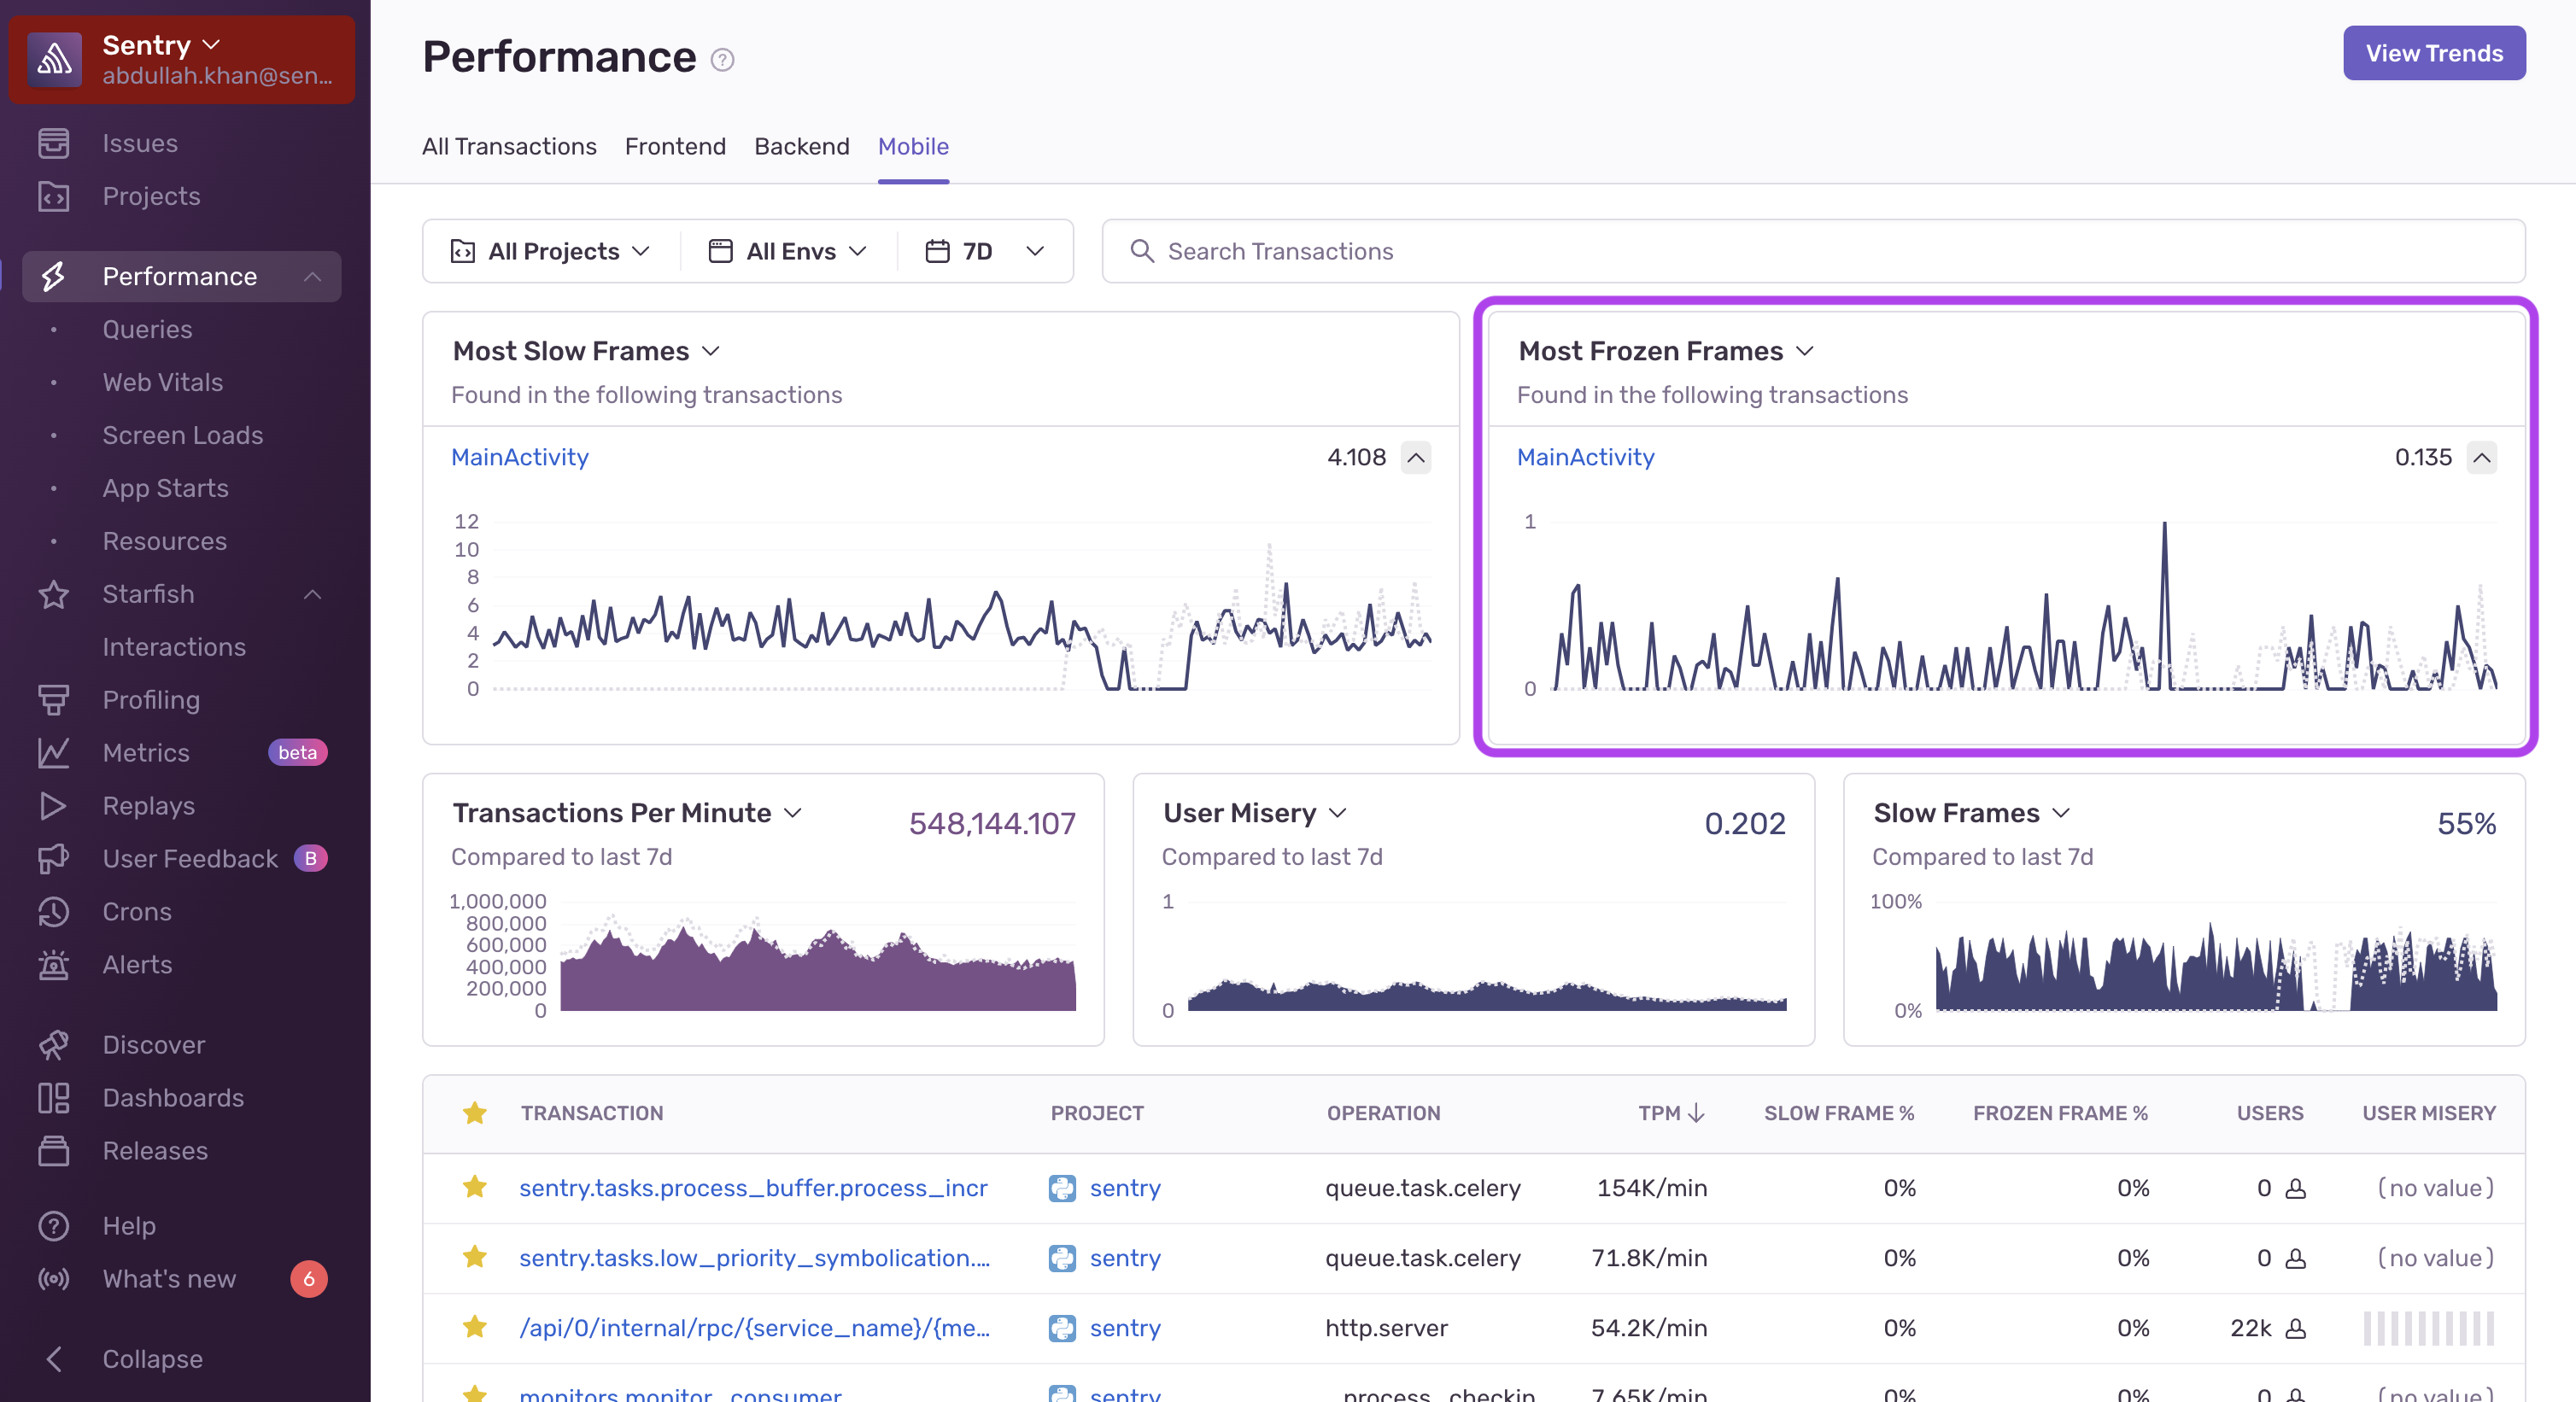
Shows transactions with the most frozen frames for mobile projects. Learn more in Mobile Vitals.
This widget is available in the Mobile Overview tab.
Shows database queries that take the most time in your application. These queries are usually either slow, very frequent, or both. Click on a query to open its Query Summary page or click "View All" to open the Queries page.
This widget is available in the Backend Overview.

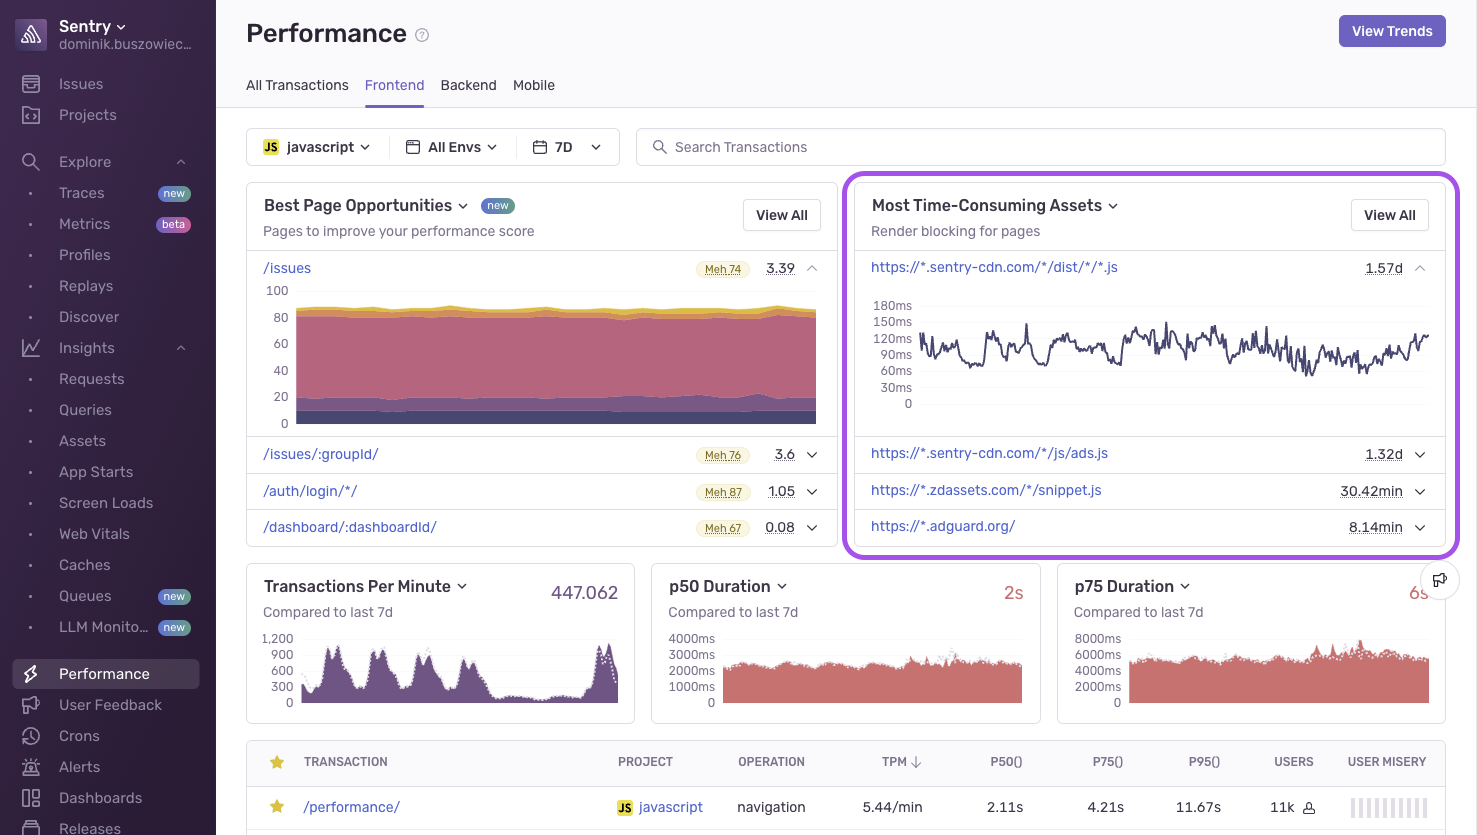
Shows assets that take the most time in your application. These assets are usually either slow, very frequent, or both. Click on a asset to open its Asset Summary page or click "View All" to open the Assets page.
This widget is available in the Frontend Overview.
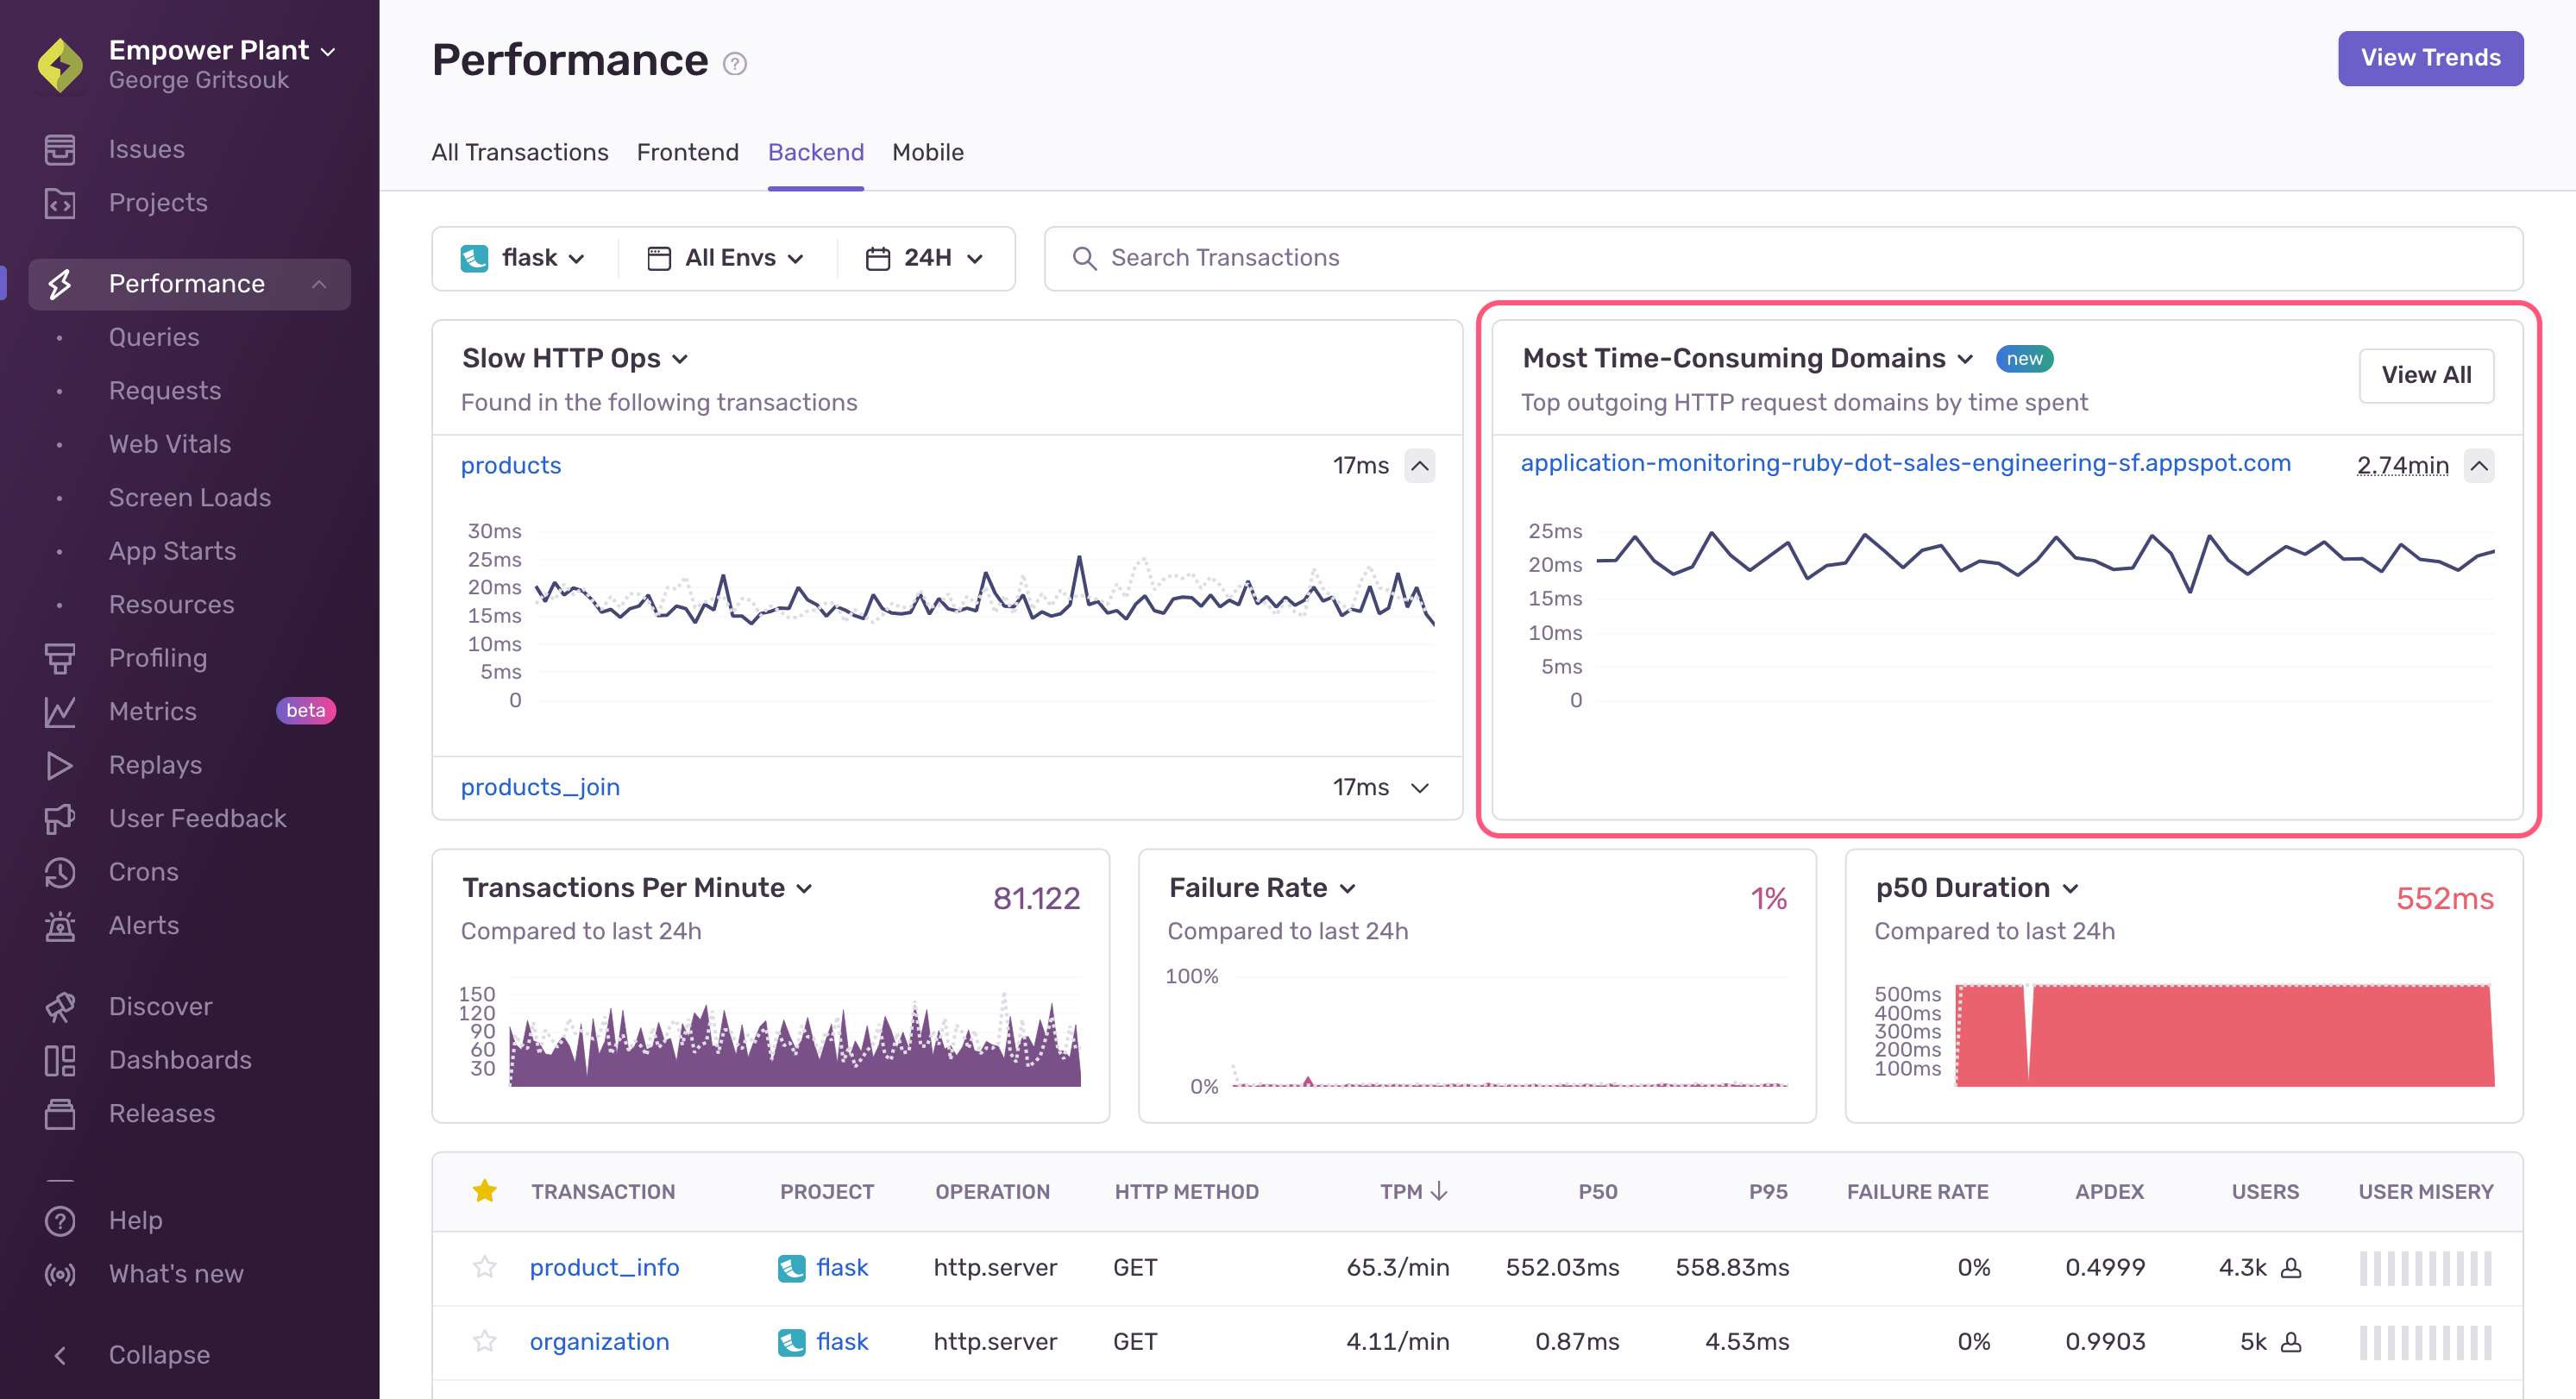
Shows domains that the application spends a lot of time waiting for, sorted by total time per domain. The application either makes a lot of calls to these domains, or these domains take a long time to respond to requests. Click on a domain to open its Domain Summary page or click "View All" to open the Requests page.
This widget is available in the Backend Overview, Frontend Overview and Mobile Overview tabs.
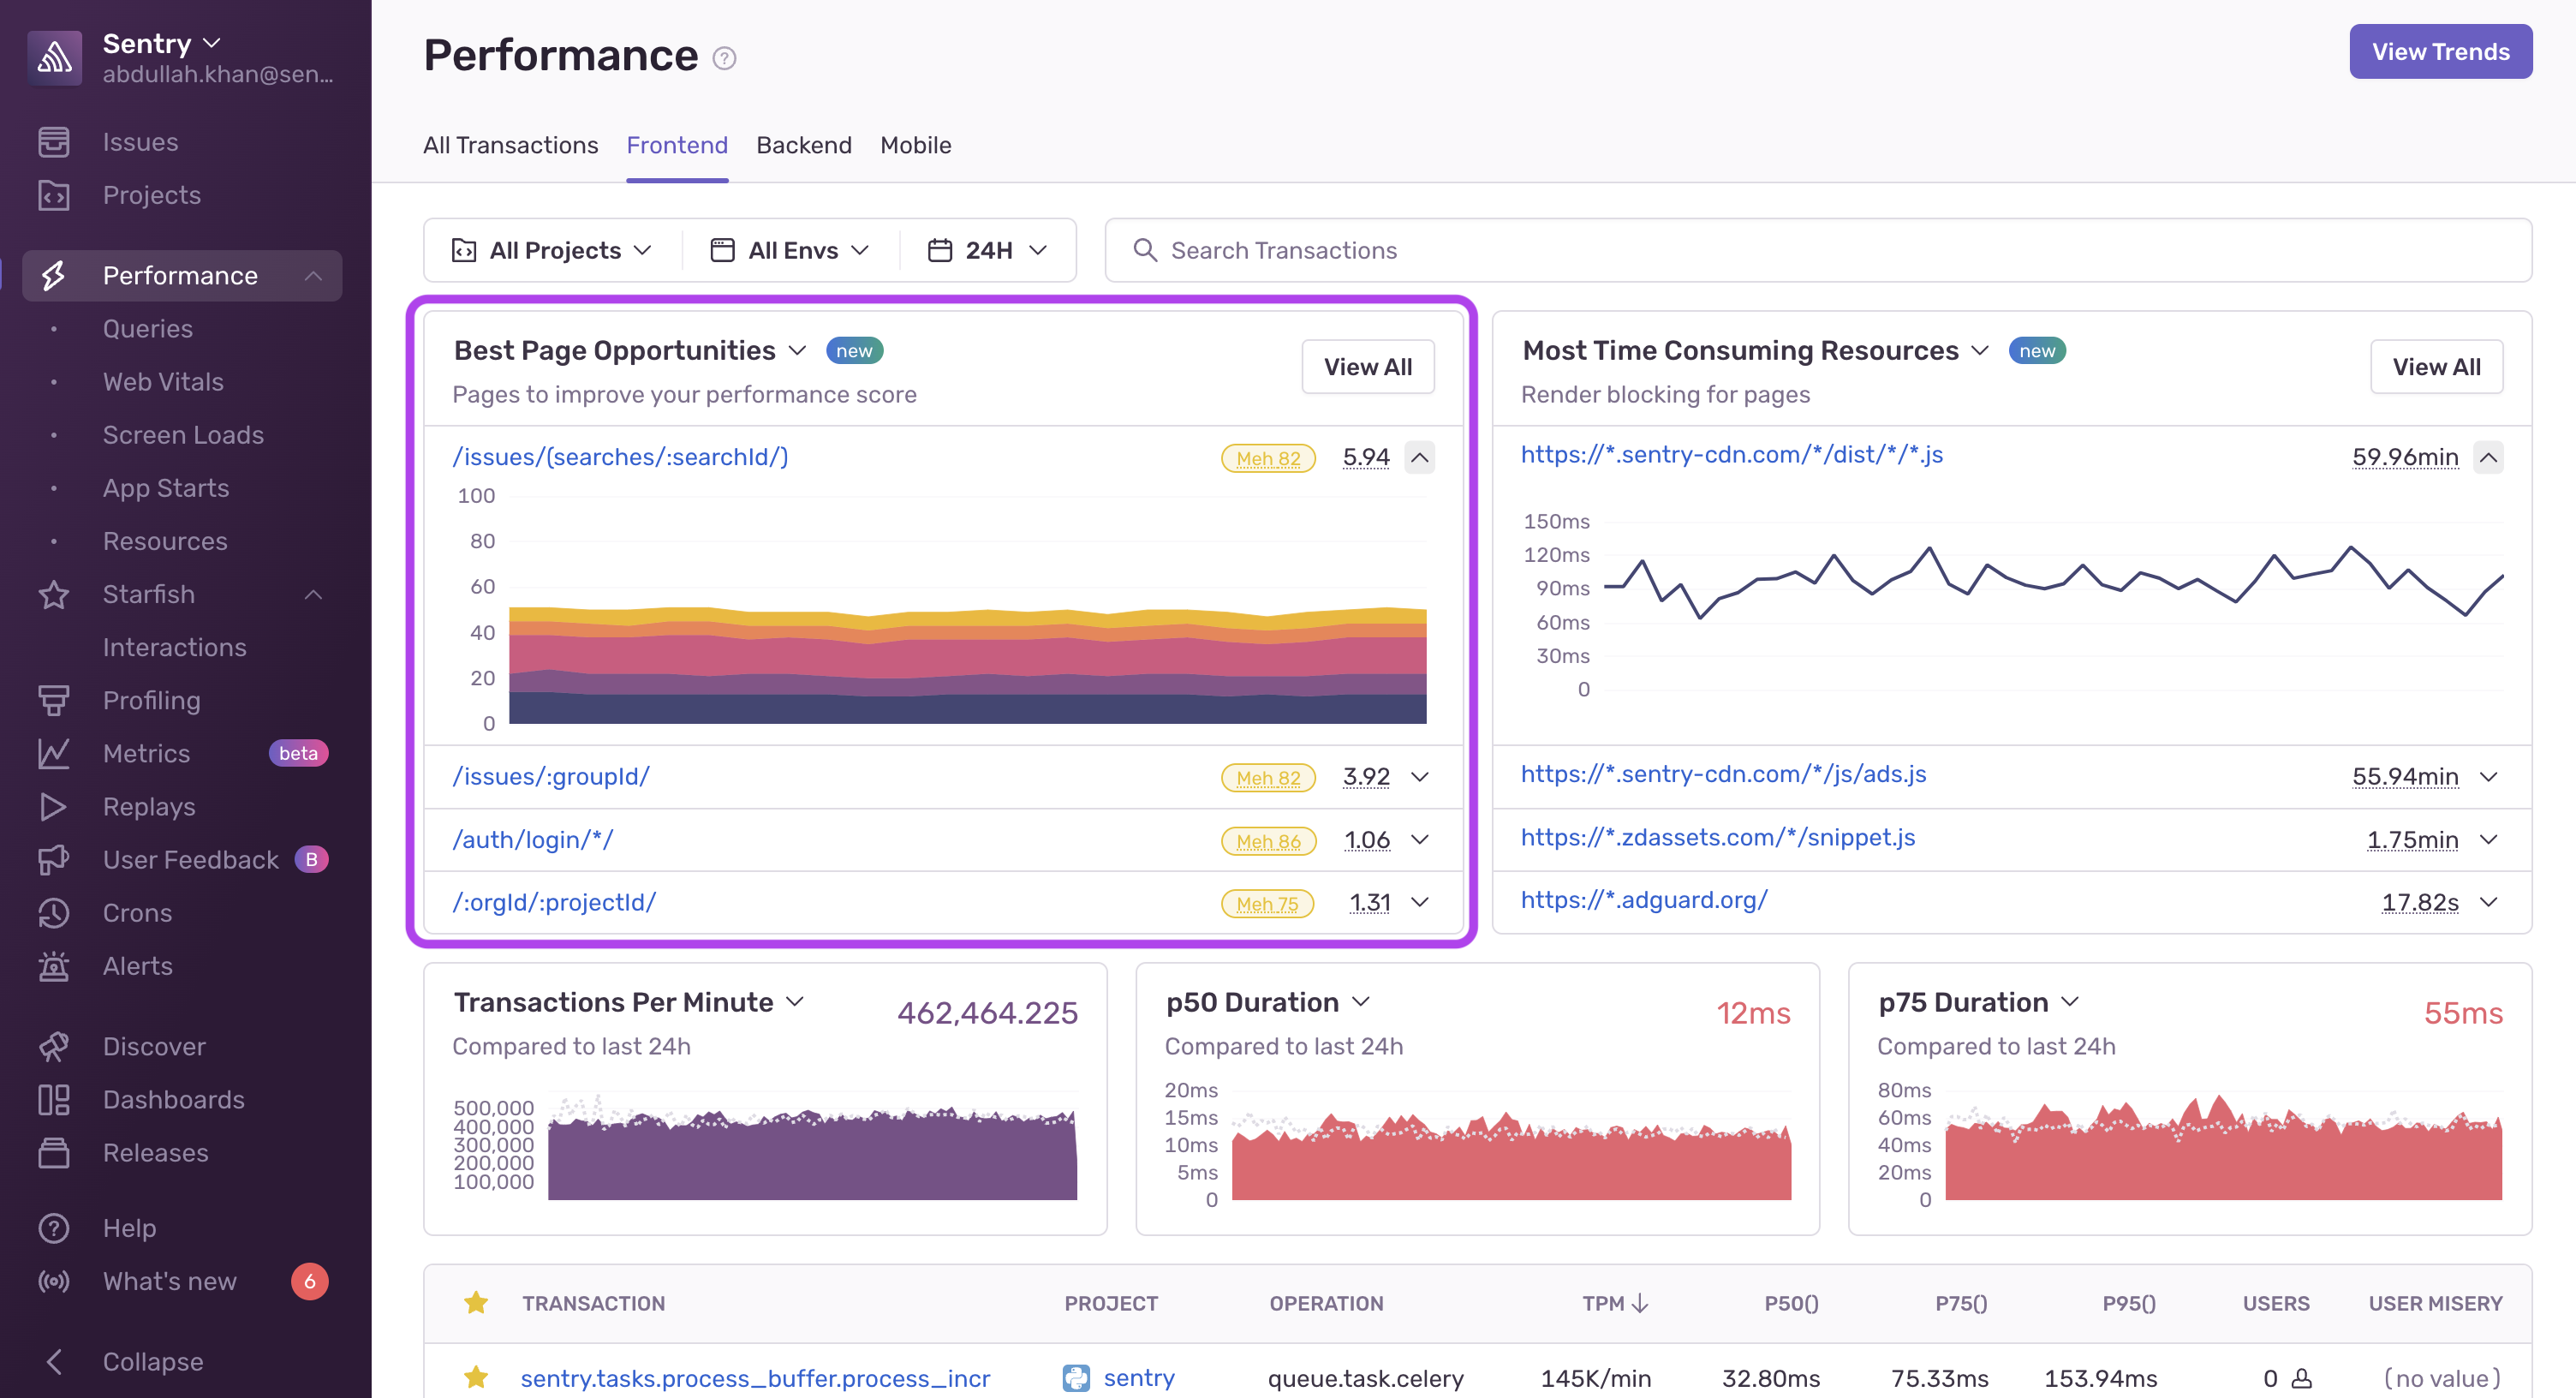
Shows web pages in your application that have the most Opportunity to improve. These pages usually have poor Web Vital scores, high throughput, or both. Click on a page to open its Page Overview page or click "View All" to open the Web Vitals page.
This widget is available in the Frontend Overview.
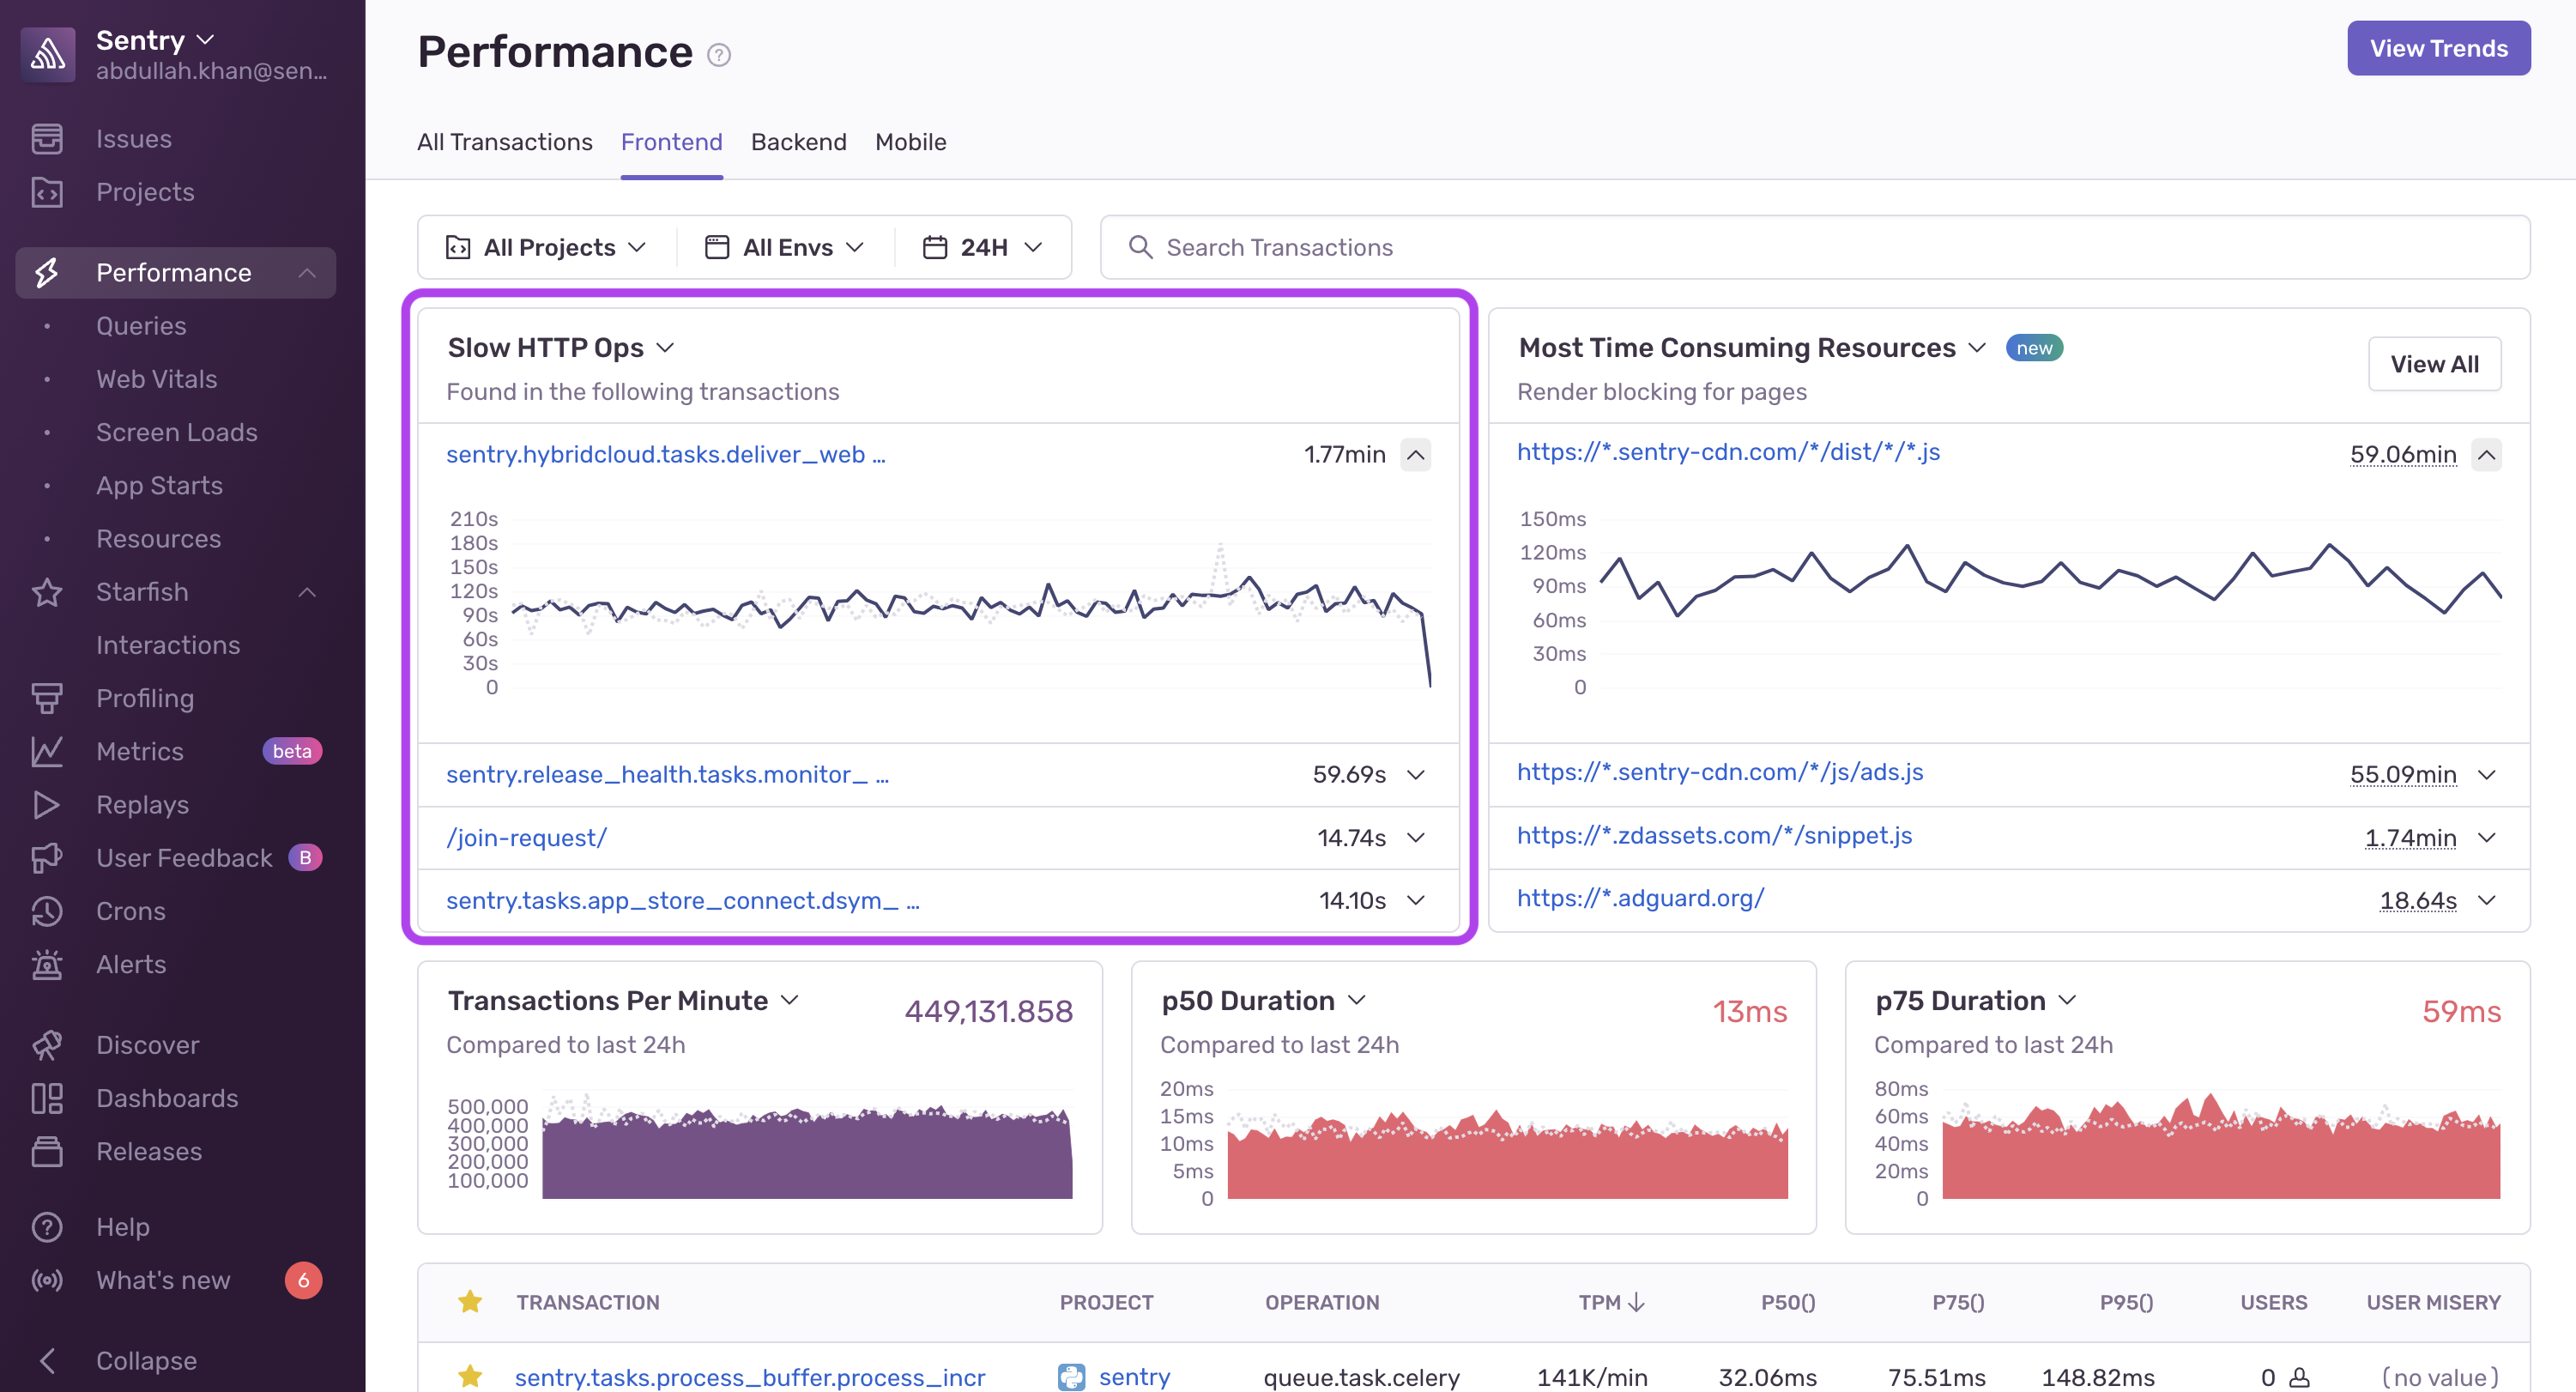
Shows transactions with slow cumulative HTTP spans. Slow HTTP ops are not shown for all projects and transactions as the transactions must contain HTTP spans. Check out the SDK documentation for the project in question for more information.
This widget is available in the Frontend Overview and Backend Overview tabs.
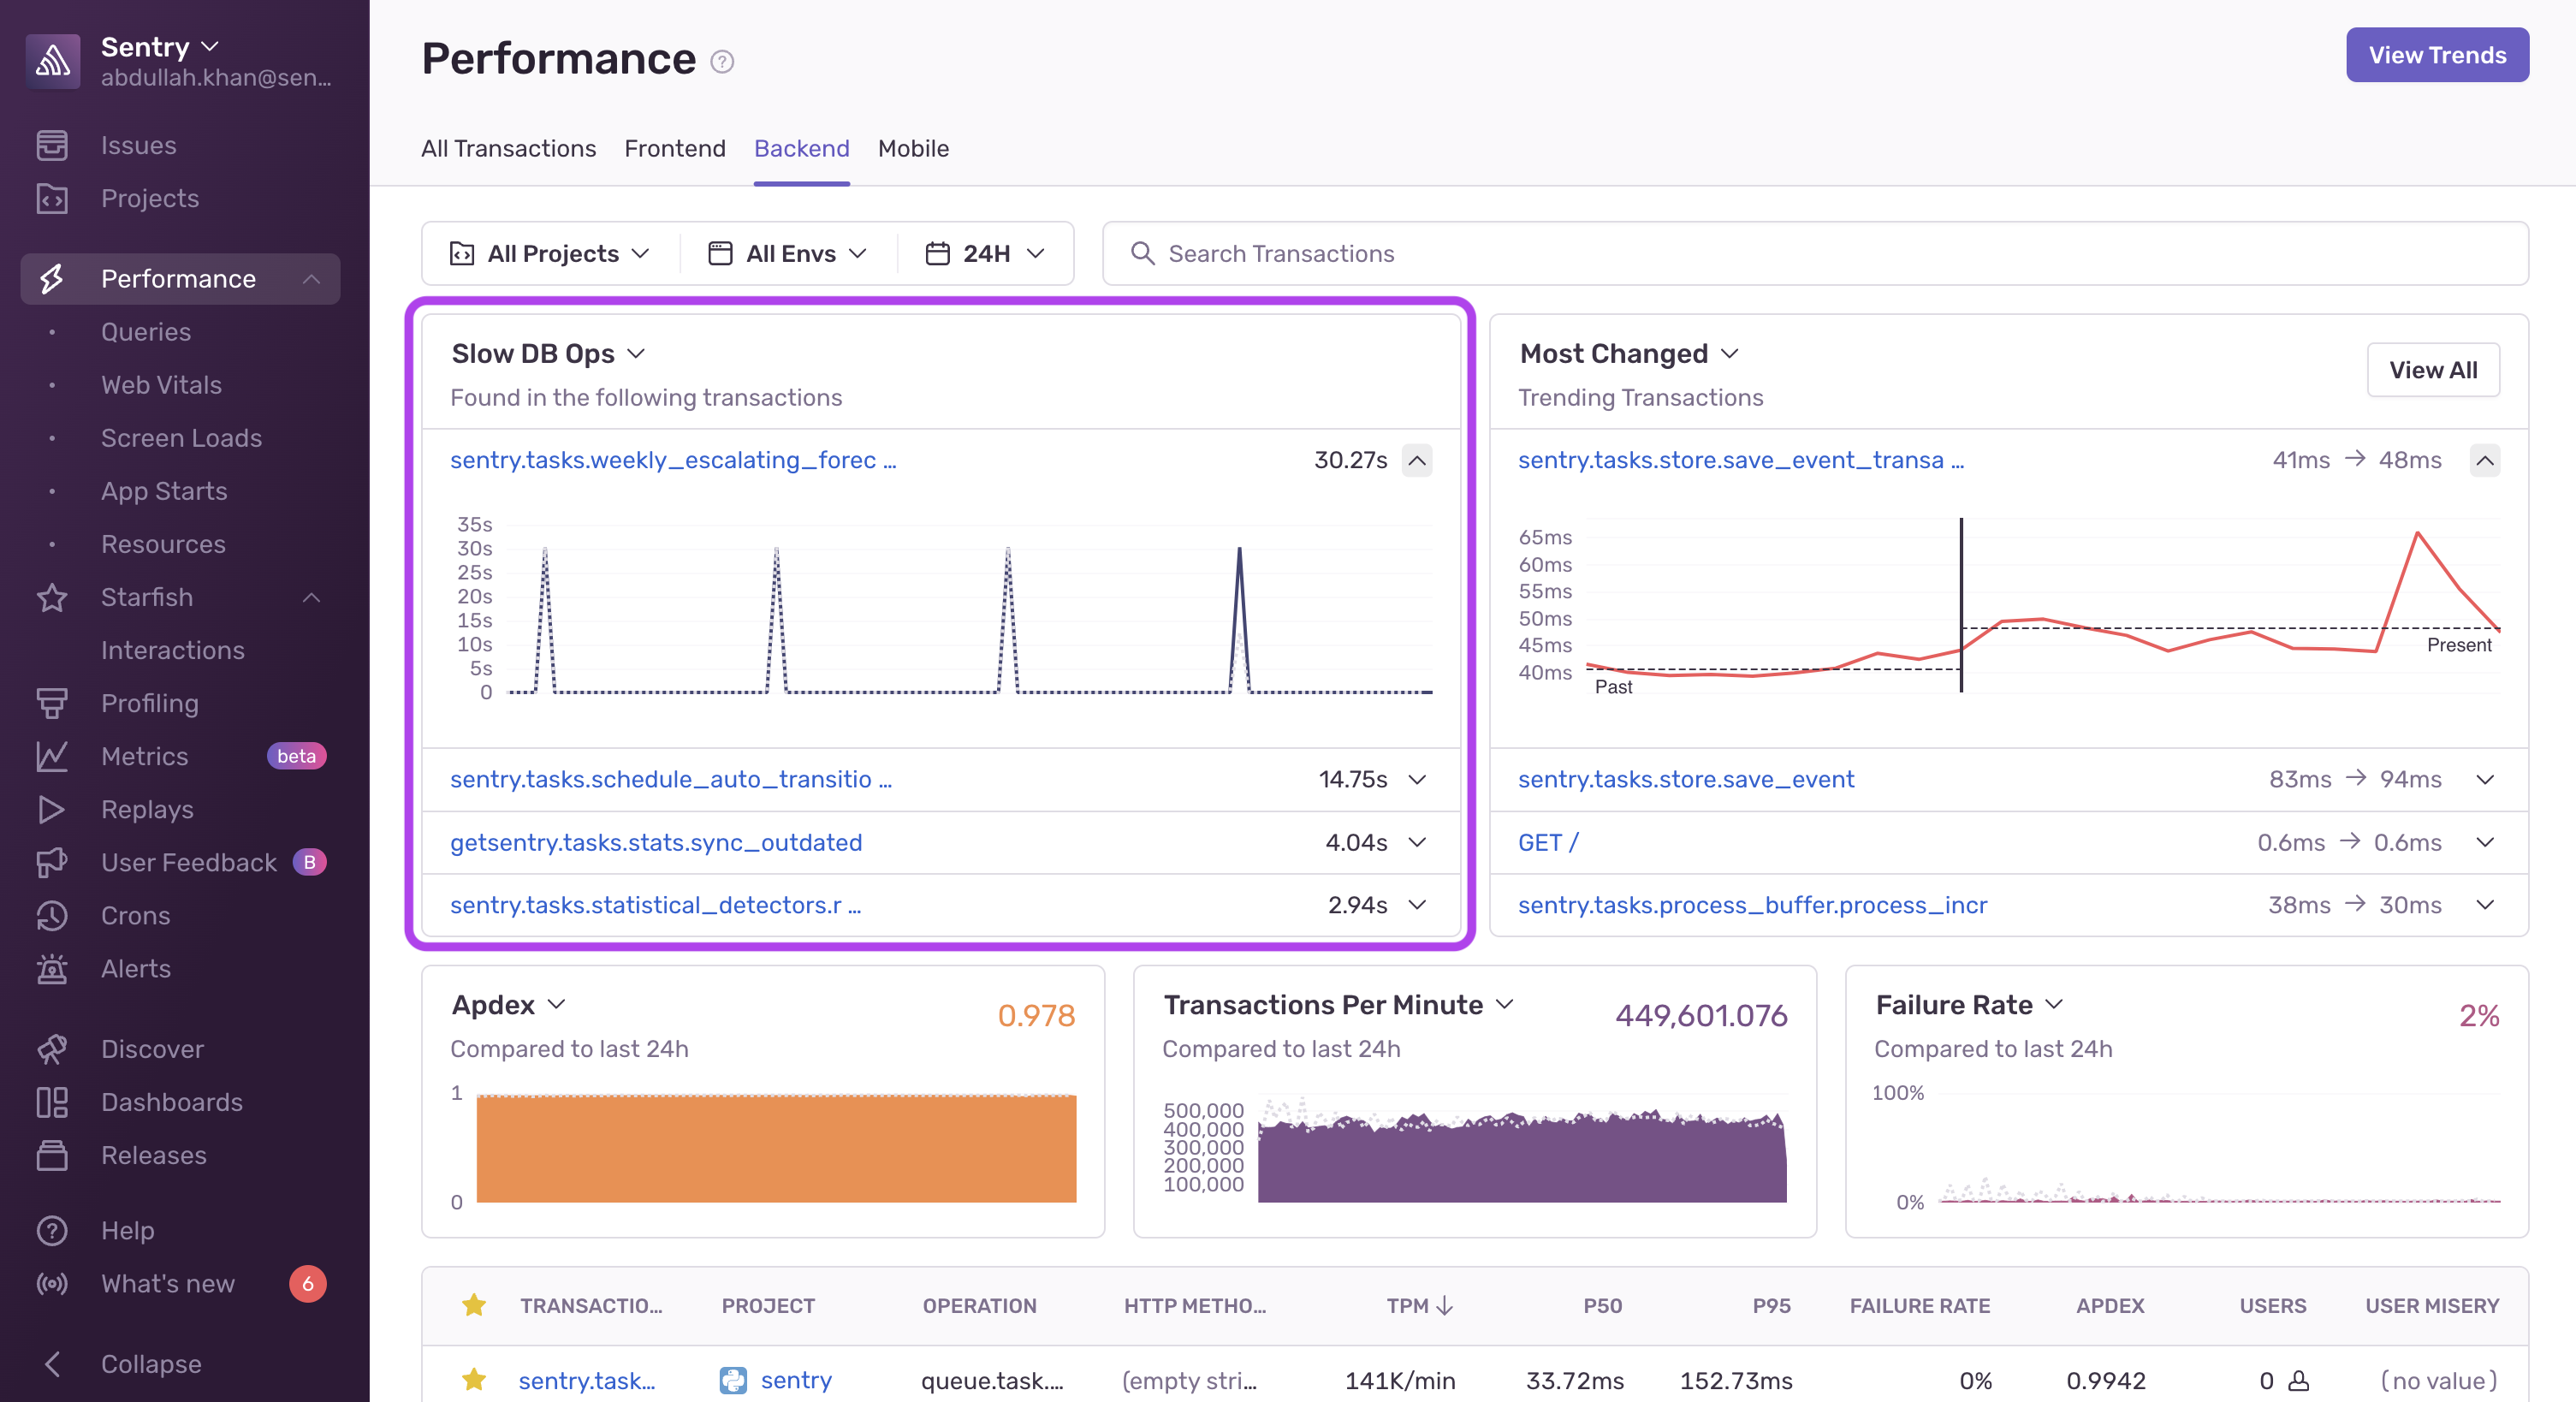
Shows transactions with slow cumulative DB spans. Slow DB ops are not shown for all projects and transactions as the transactions must contain DB spans. Check out the SDK documentation for the project in question for more information.
This widget is available in the Backend Overview.
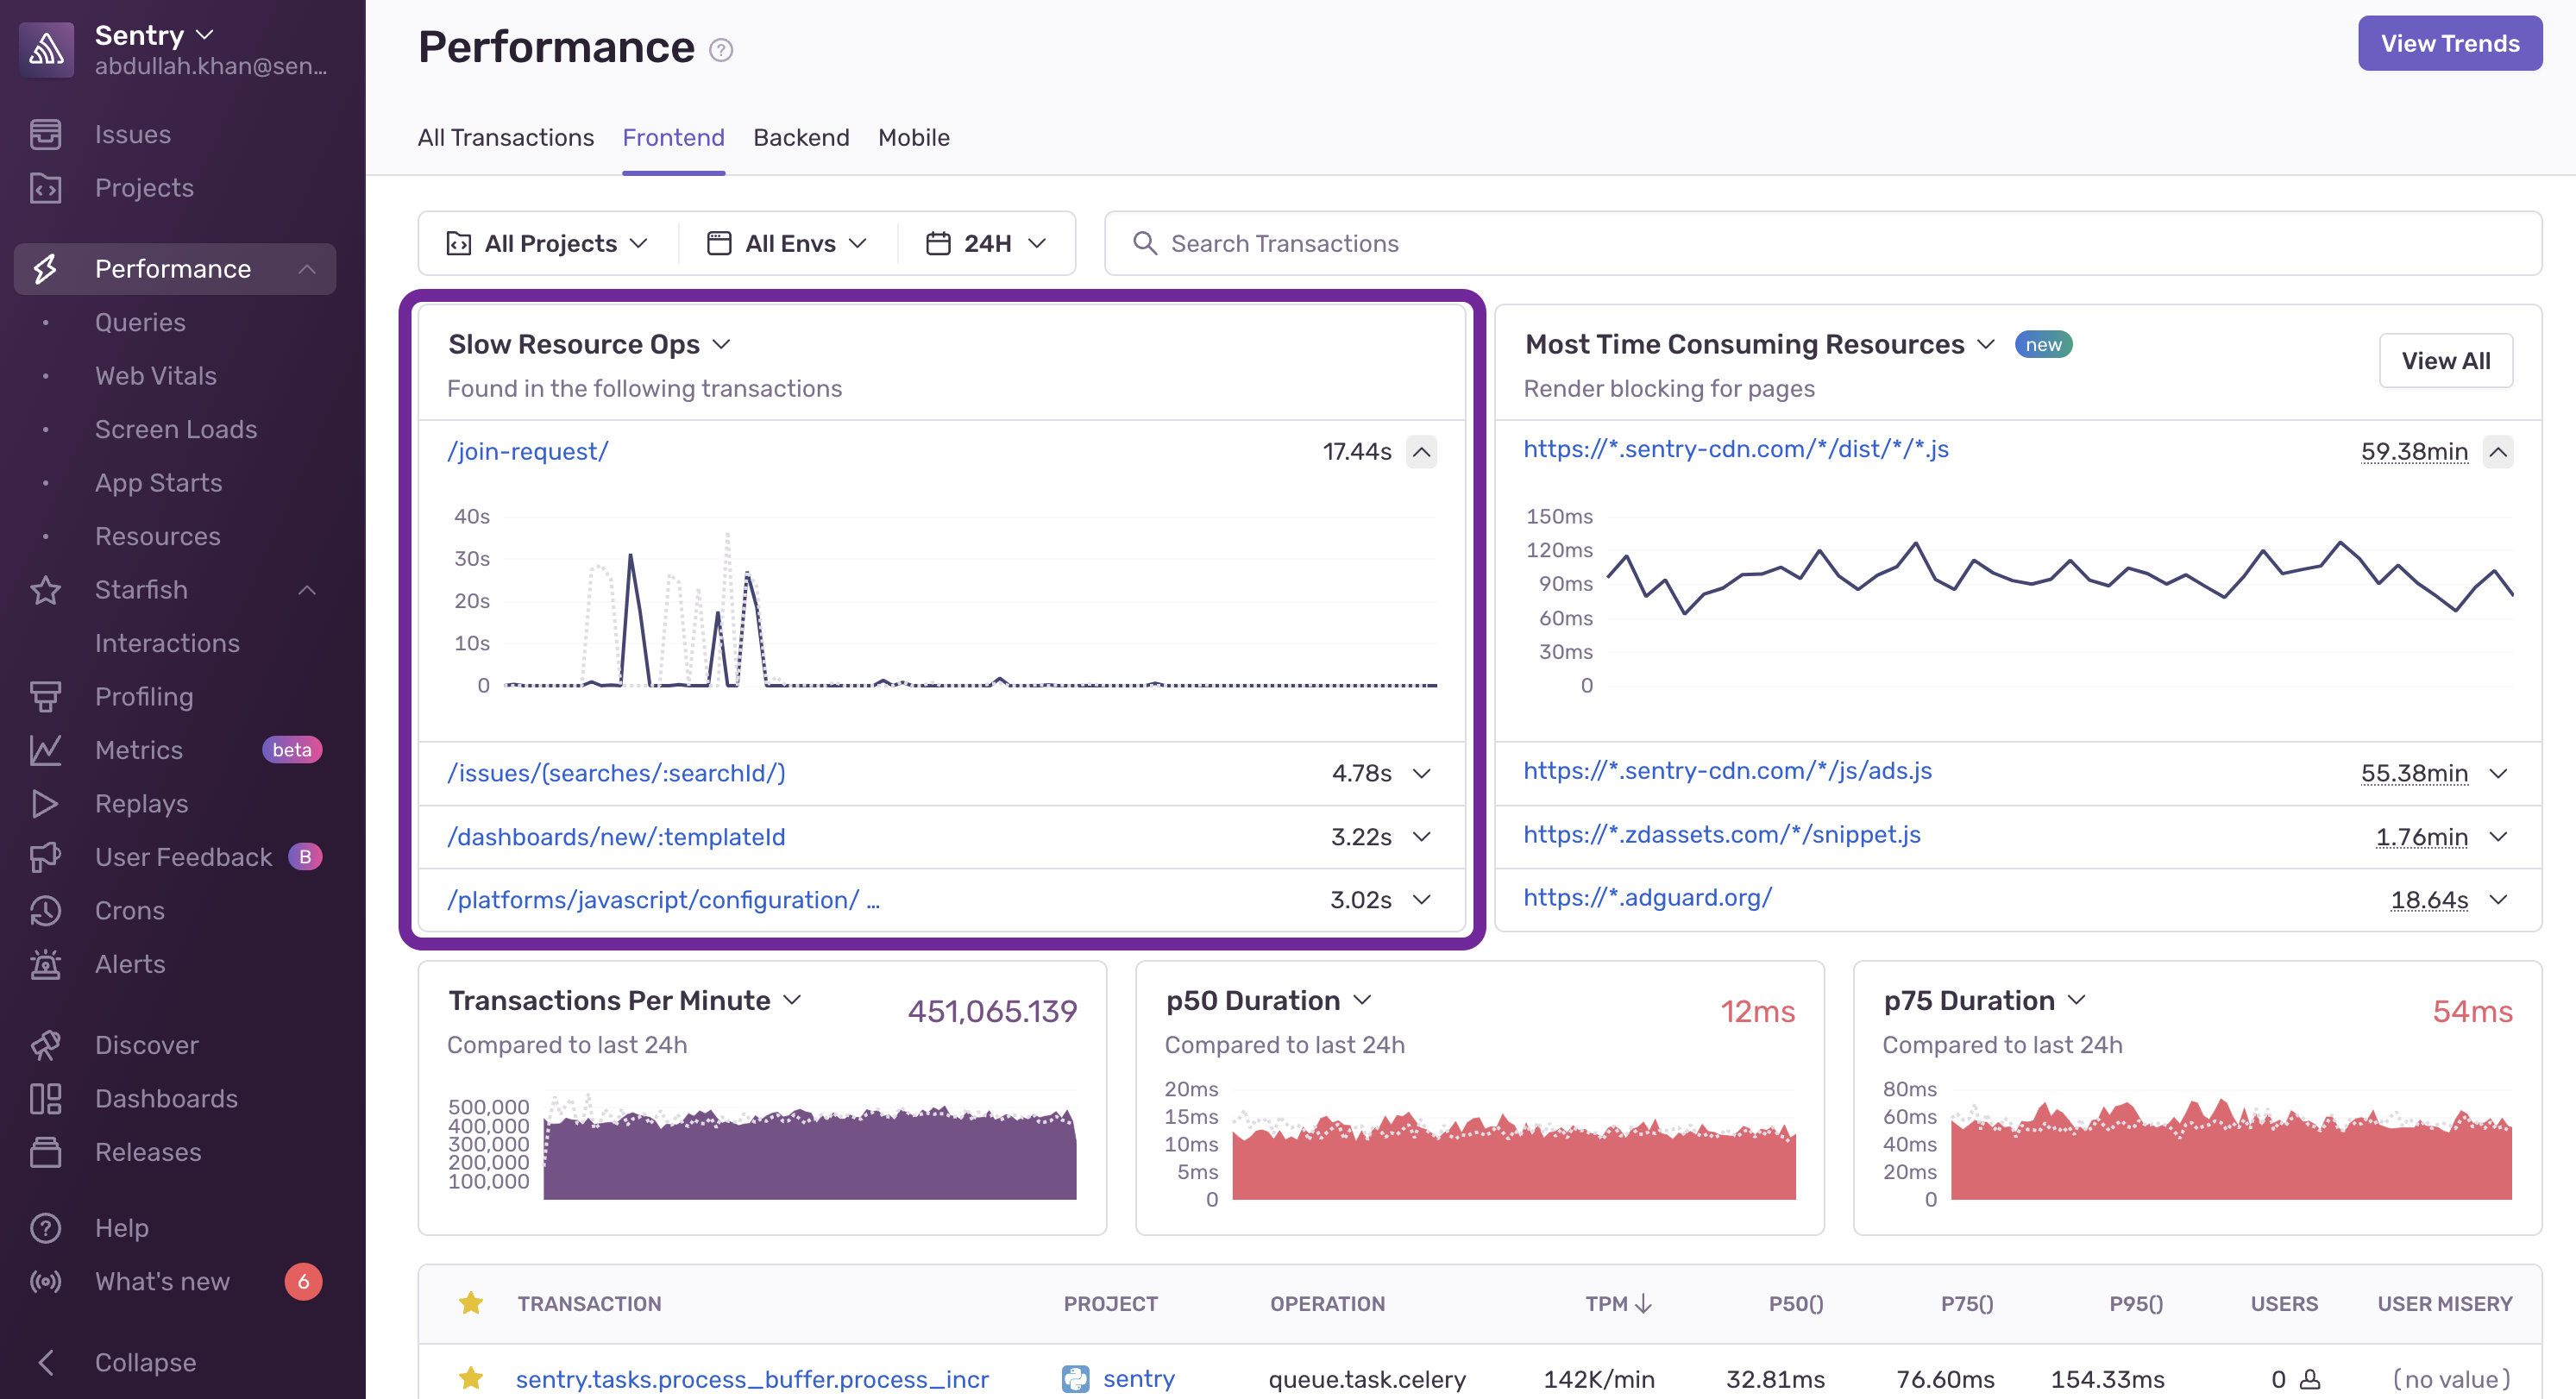
Shows transactions with slow cumulative resource spans. These show frontend transactions with poor performing resources spans, and show cumulative time spent loading scripts, CSS, and so on.
This widget is available in the Frontend Overview.
Our documentation is open source and available on GitHub. Your contributions are welcome, whether fixing a typo (drat!) or suggesting an update ("yeah, this would be better").